Understanding Native Ads
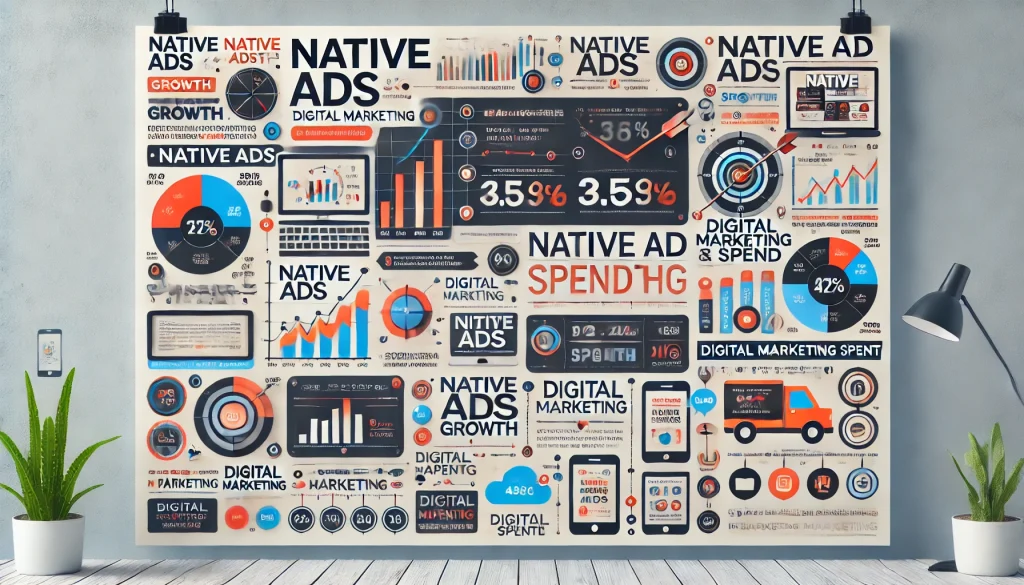
As digital marketing continues to evolve, native ad spending has emerged as one of the most promising trends, reshaping the advertising landscape. This blog post will dive deep into the surge of native ad spending, uncovering the nuances behind its increasing popularity. By employing a visually appealing infographic, we will depict the growth journey, key statistics, and pertinent elements that contribute to the native ad renaissance. Let's explore the dynamics of native ad spending in digital marketing.
The Rise of Native Ad Spending: An Overview
In recent years, native advertising has garnered significant traction as marketers seek more engaging and less intrusive ways to connect with audiences. Characterized by its seamless integration with content, native ads have proven to be highly effective in delivering personalized experiences that captivate consumers.
Historical Growth
The growth trajectory of native ad spending is nothing short of remarkable. According to recent data, global native ad spend has seen exponential increases, demonstrating a clear shift in marketing strategies:
* In 2017, native ad spending stood at approximately $15 billion.
* By 2020, this figure had risen to $26 billion.
* Projections for 2023 estimate native ad spending to exceed $42 billion.
These figures underscore an evident preference for native advertising among digital marketers, driven by enhanced audience targeting and consumer engagement.
Creating the Perfect Infographic: Components and Visual Appeal
A well-designed infographic can be instrumental in conveying complex data points in an engaging and intuitive manner. Here’s how you can structure an infographic to highlight the burgeoning trend of native ad spending:
1. Graphs and Charts
Incorporating line graphs or bar charts to illustrate the increase in native ad spending over recent years is paramount:
* **Line Graph**: Display year-on-year growth in native ad spending from 2017 to 2023.
* **Bar Chart**: Showcase comparative spending across different types of digital ads, highlighting native advertising’s rising share.
2. Money Iconography
Visual elements such as dollar signs, stacks of coins, and upward-pointing arrows can effectively depict financial growth:
* Dollar Signs: Place these next to significant spending figures to highlight key monetary milestones.
* Stack of Coins: Use this to represent total spending in various years.
* Upward-Pointing Arrows: Indicate steady growth trends and increasing investment in native advertising.
3. Digital Devices
Featuring smartphones, tablets, and laptops can signify the platforms where native ads predominantly appear:
* Smartphones: Illustrate ads optimized for mobile devices, which constitute a major segment of digital consumption.
* Tablets and Laptops: Depict the versatility of native ads across different digital screens.
4. Ad Elements
Icons representing in-feed ads, search ads, and content recommendations offer clarity on the types of native advertisements thriving in the digital space:
* In-feed Ads: Native ads appearing within content feeds like social media, blending seamlessly with organic content.
* Search Ads: Paid advertisements that appear natively within search engine results.
* Content Recommendations: Sponsored content that is presented as a suggested reading material, enhancing user experience.
5. Color Scheme
Using a professional yet vibrant colour palette is essential for making the infographic visually appealing without compromising on clarity. Consider these hues:
* Blues and Greens: Often used to indicate growth and financial stability.
* Reds: To highlight critical data points or warnings.
* Yellows and Oranges: For areas that need to attract attention.
6. Text Annotations
Incorporate brief text annotations to highlight key statistics and data points:
* Growth Percentages: Mention percentage increases year-over-year.
* Total Spending Amounts: Display clear monetary values for different years to show clear comparisons.
Advantages of Native Advertising
Native advertising has several unique advantages that explain its rising popularity:
- Enhanced User Experience: Native ads are less intrusive, offering a seamless integration with the content that users are already engaged with. This leads to a more pleasant user experience.
- Higher Engagement Rates: Since native ads blend in with organic content, they tend to attract higher engagement rates compared to traditional display ads.
- Better Performance Metrics: Marketers have reported that native ads often outperform traditional ads in terms of click-through rates (CTR) and conversion rates.
- Advanced Targeting: The ability to target ads more accurately ensures that businesses can reach their desired audience more effectively, improving the return on investment (ROI).
Challenges and Considerations
While the benefits are substantial, native advertising comes with its own set of challenges:
- Disclosure Issues: Ensuring that ads are clearly labeled to distinguish them from organic content can sometimes be complex.
- Creative Fatigue: As more brands adopt native advertising, the competition to stand out increases, leading to potential creative fatigue.
- Measurement Difficulties: Unlike traditional ads, the performance metrics for native ads can be difficult to measure and compare uniformly.
Conclusion
The rising trend of native ad spending reflects a paradigm shift in digital marketing, prioritizing user experience, engagement, and advanced targeting capabilities. By utilizing a modern infographic, brands can effectively convey the explosive growth and multifaceted nature of native advertising to their audiences.
This comprehensive visualization not only helps in understanding current trends but also aids in strategic planning for future marketing endeavors. As native ad spending continues to soar, staying informed and adaptable becomes essential for marketers aiming to leverage the full potential of this dynamic advertising format.


